
Quick Steps: Shop Analytics > Sales Analysis (Product) or Sales Analysis (Size/Colour Breakdown)
Sales Analysis gives you a breakdown of how many of each product you have sold over a period of time. This can be filtered to limit to a certain period, or you can view the breakdown either by Product, or further broken down into Colours and Sizes.
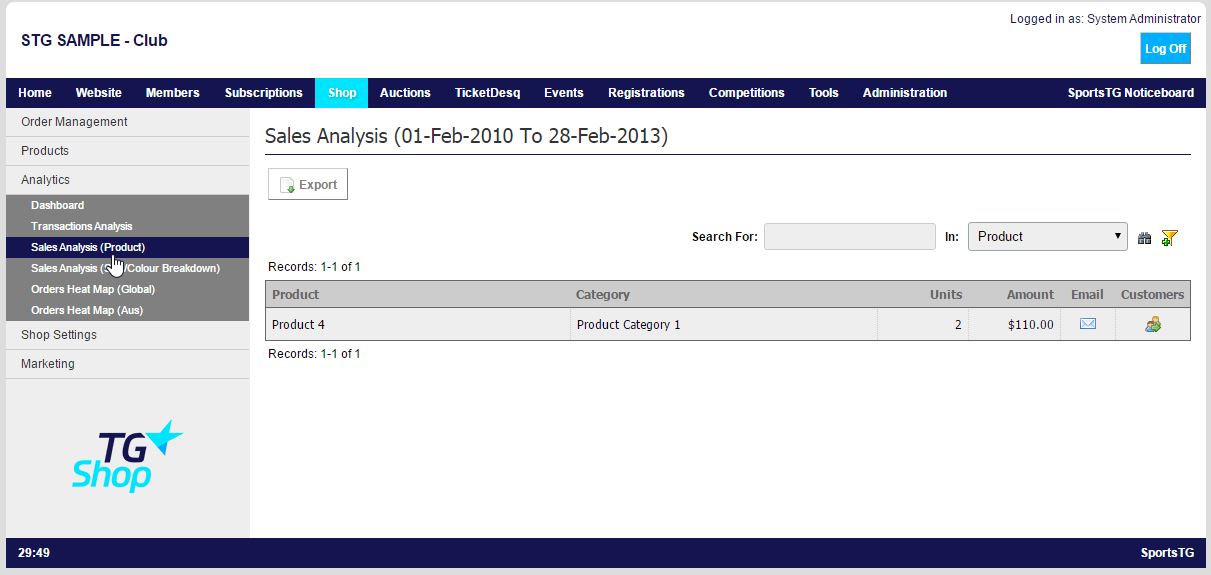
1. Within the Management Console, select Shop from the top menu, then Analytics from the left menu.2. Select Sales Analysis (Product)
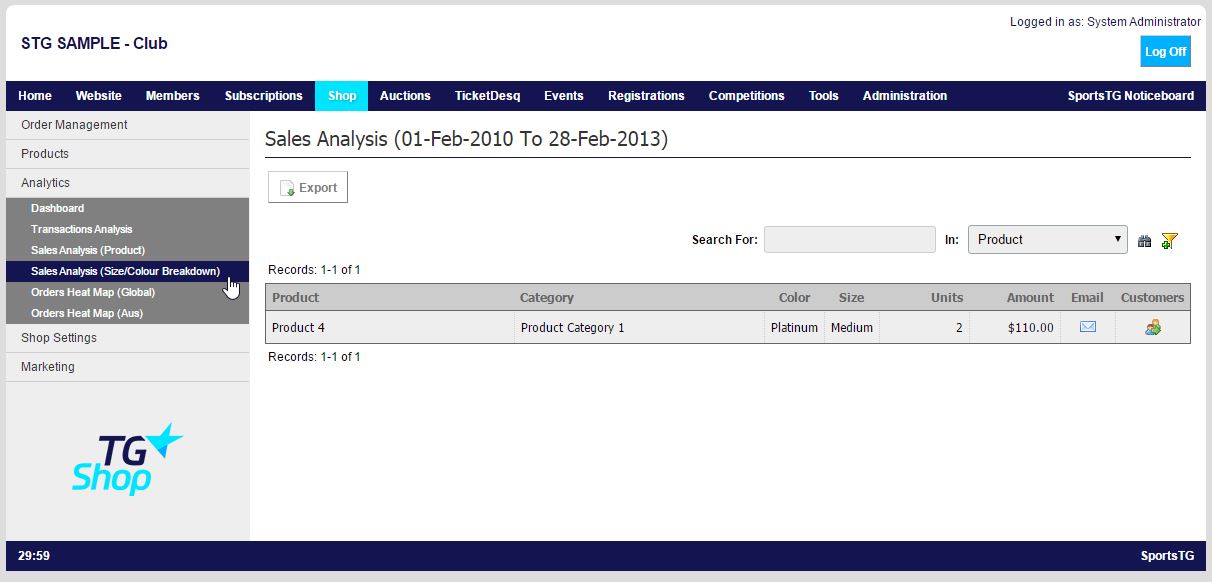
or Sales Analysis (Size/Colour Breakdown) from the expanded left menu.
- Total Units sold per product (Units Column)
- Total Revenue per product (Amount Column)
- Email all Customers who purchased that product (Email Column)
- View a list of Customers who purchased that product (Customers Column)
- View a further breakdown of Total Units sold and Total Revenue based upon Colour and Size
- Export data into Excel
- Filter dates to get specifics for a time period